Poll Results of May 7
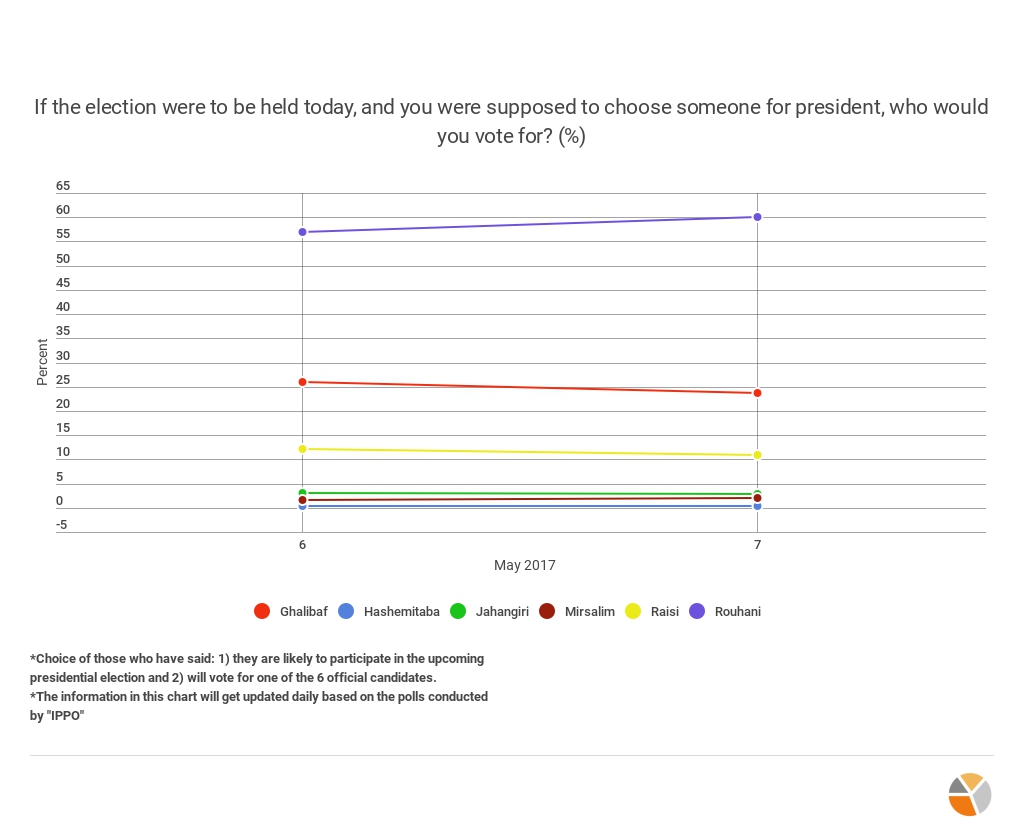
The First Choice Voting Pattern
About 57 percent of people who say 1) they will definitely participate or are likely to participate in the May 2017 election and 2) are inclined to vote for one of the current six candidates, have decided on Hassan Rouhani as their first choice in recent days. In other words, if the election were to be held today, Hassan Rouhani would have probably been elected president in the first round of the election.
However, in the coming days, as we continue with the polls and as the election day gets closer, it can better be determined whether these patterns will hold steady or they will shift and transform.
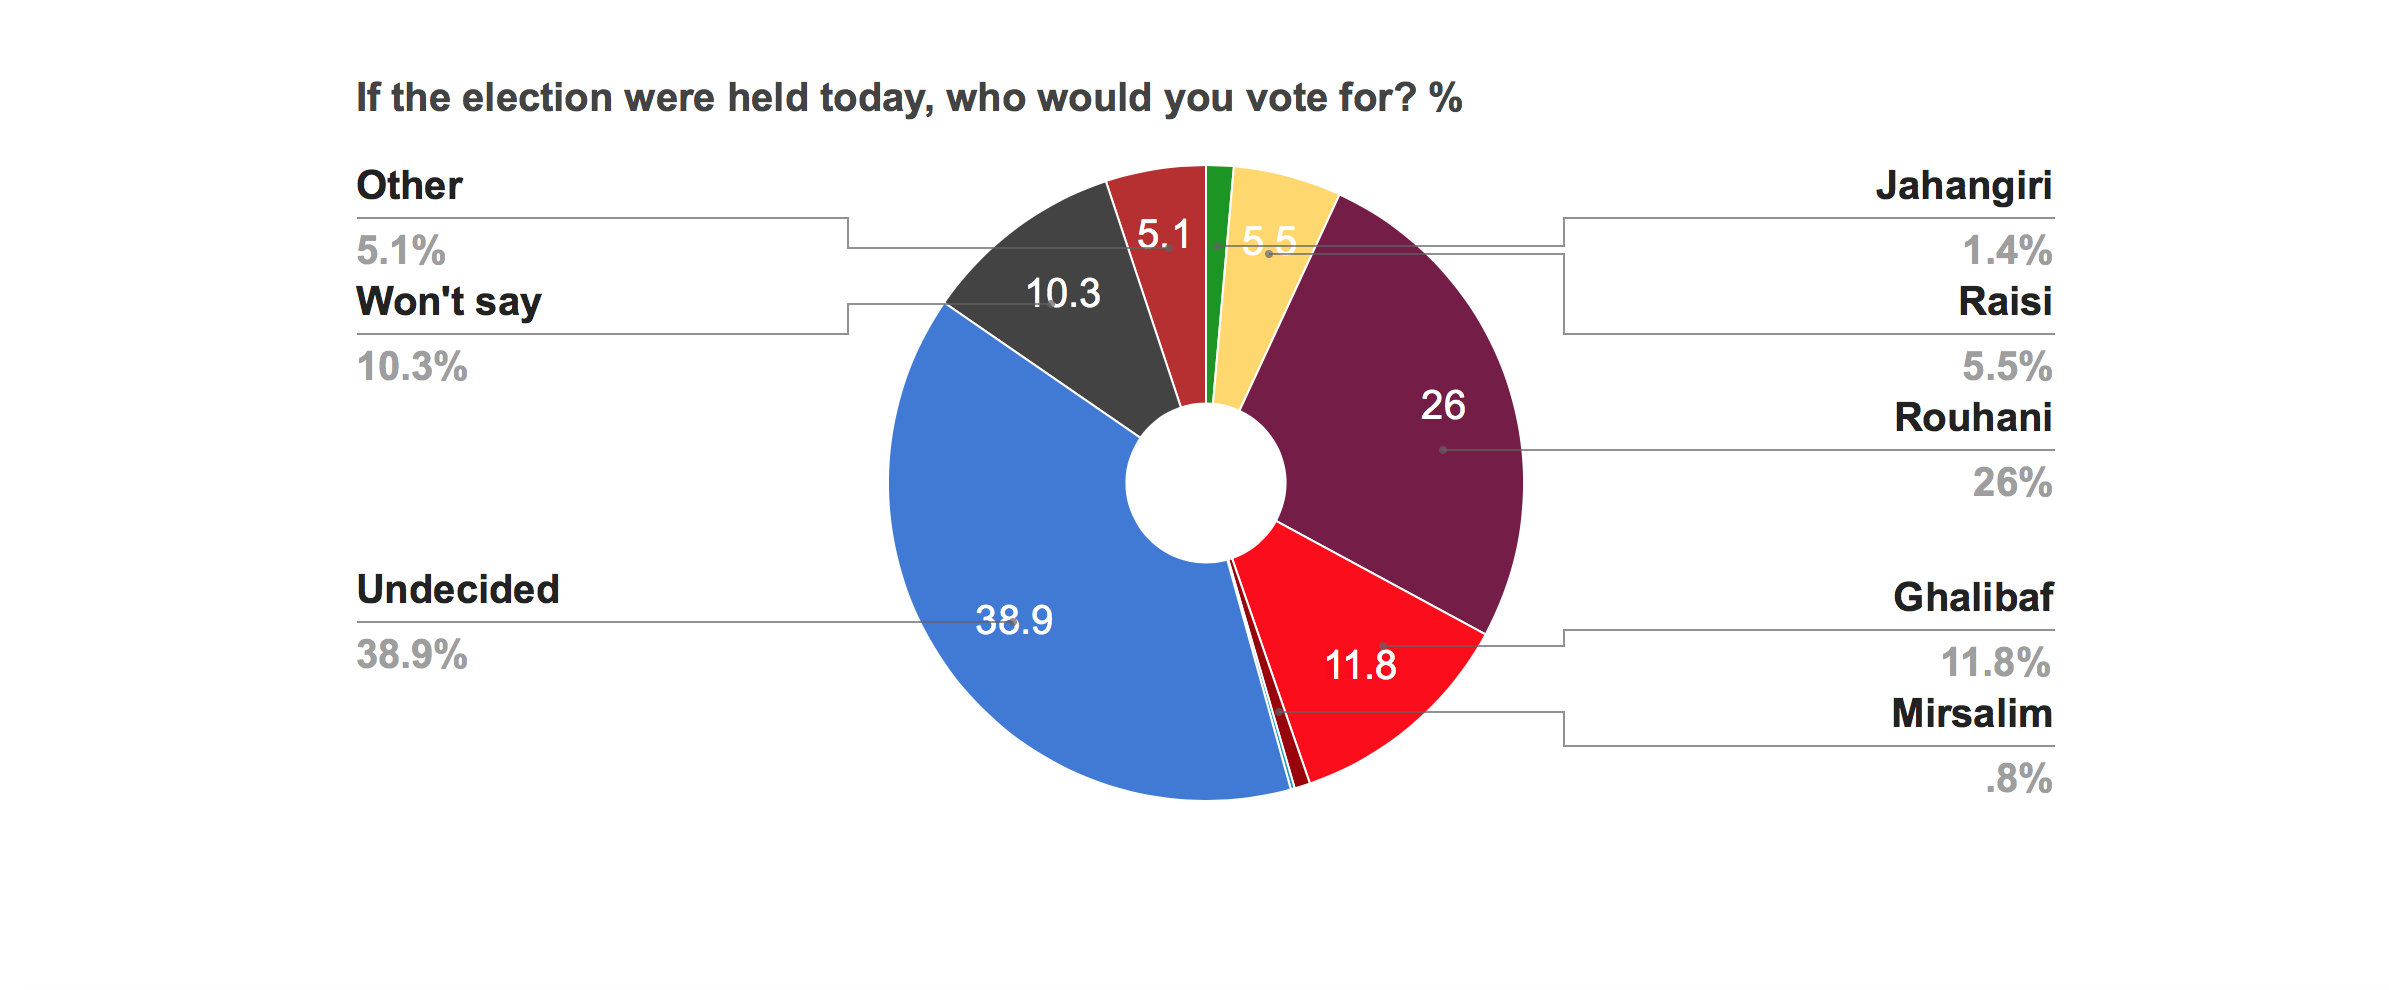
It is notable that 40% of voters remain undecided at this time.The undecided voters’ turnout can drastically change the current ranking pattern among candidates. The undecided voter’s final decision can also potentially take the elections to a run-off.
Second Choice Voter Preferences
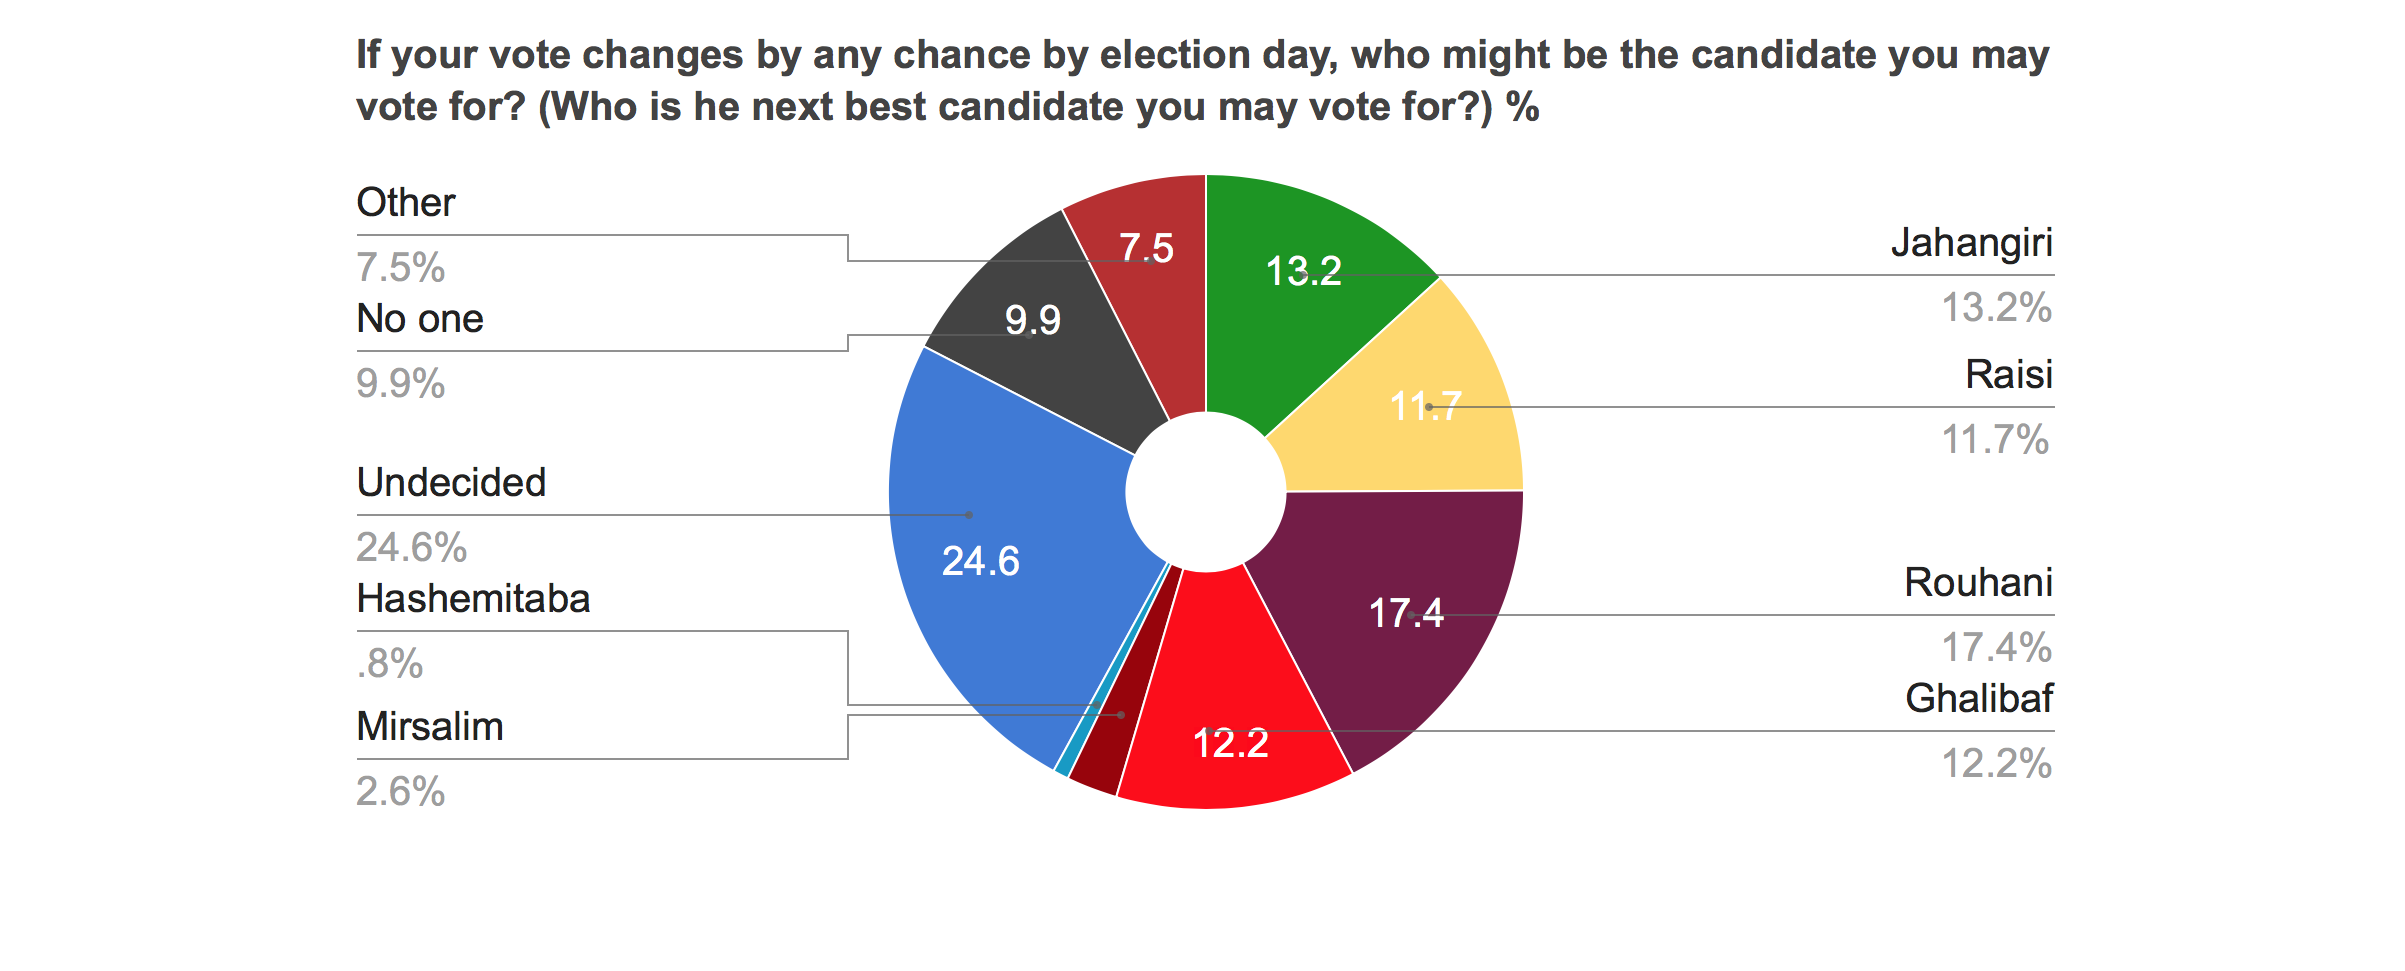
Respondents were asked if they were to change their minds by election day, which candidate they’ll choose to vote for. The response to this question generates a different pattern than the first-choice candidate results.
Even though Hassan Rouhani still remains the front-runner with 17% of the vote, but here, Eshaq Jahangiri, Rouhani’s vice president, takes the second place with 13% of the vote. Ghalibaf, Raisi, Hashemitaba and Mirsalim follow Jahangiri in a descending order.
However, still a quarter of the respondents are undecided and 10% insist on their first choice, refusing to acknowledge a second-choice among candidates.
The Most Unfavorable Candidate
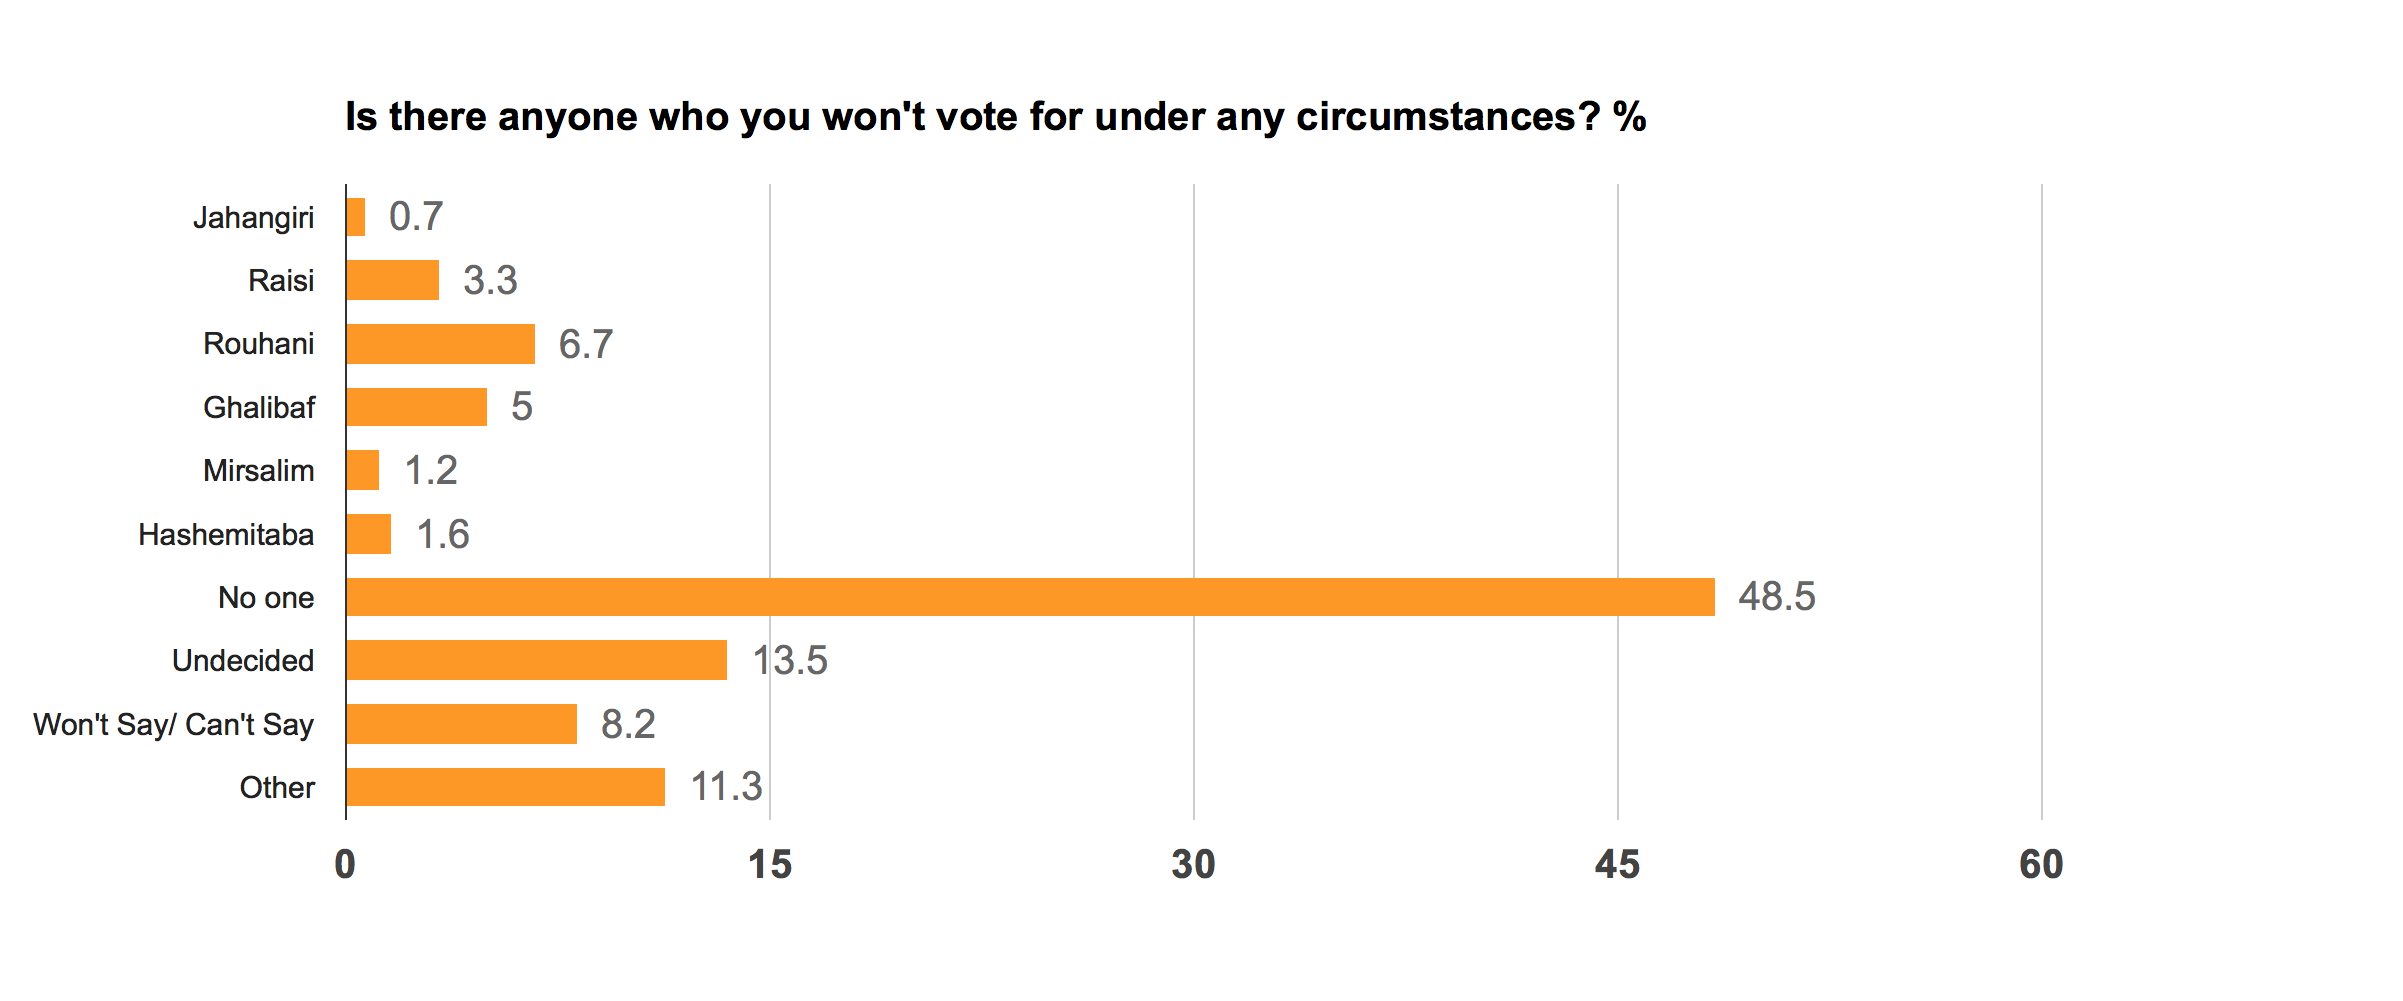
Most respondents declined to indicate which candidate is so unfavorable that they would not vote for him under any circumstance. In other words, almost 60% of the respondents either say that no one among the candidates is that unpopular in their view, or that they cannot or do not wish to name the most unfavorable candidate.
Hassan Rouhani, holds the highest unfavorability rating among candidates, with nearly 7% and is followed by Ghalibaf, Raisi, Hashemitaba, Mirsalim, and Jahangiri in a descending order.
In fact, the first three standings for the most unfavorable candidate has the exact the same pattern as the most favorable first choice candidate. One major difference is the ranking of Jahangiri who is the least unpopular candidate.
Respondents Predicting Election Results
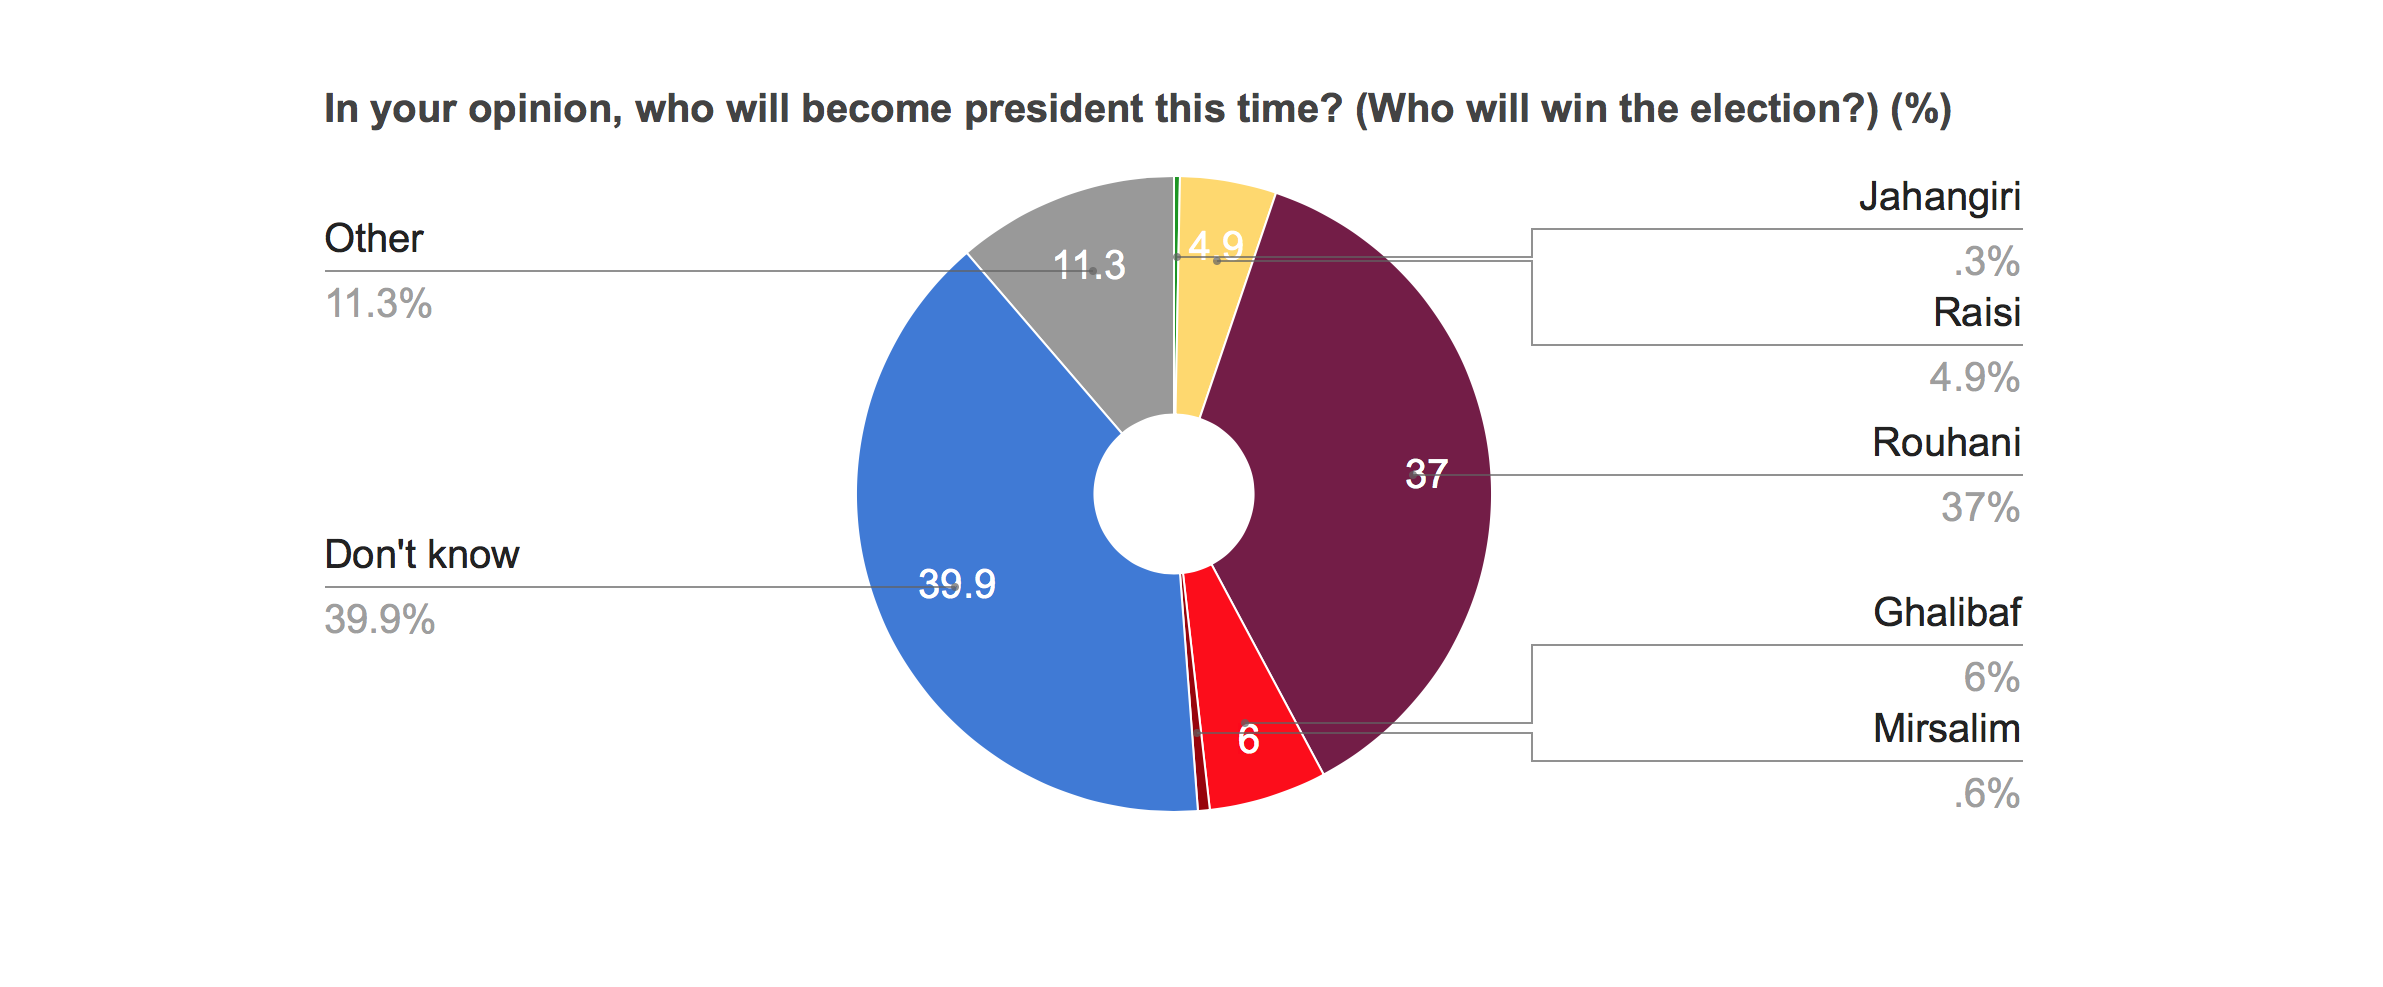
Respondents’ forecasting of the election results and the winning candidate will portray the election milieu and distinguish between respondents’ own inclination and her predictions of the final outcome.
In fact, the pattern of respondents’ prediction of the election outcome resembles that of the first choice candidate rankings. Most predictions indicate that Rouhani will be president with Ghalibaf, and Riais ranking second and third respectively.
Distinction between Vote Choice and Predicting the Results
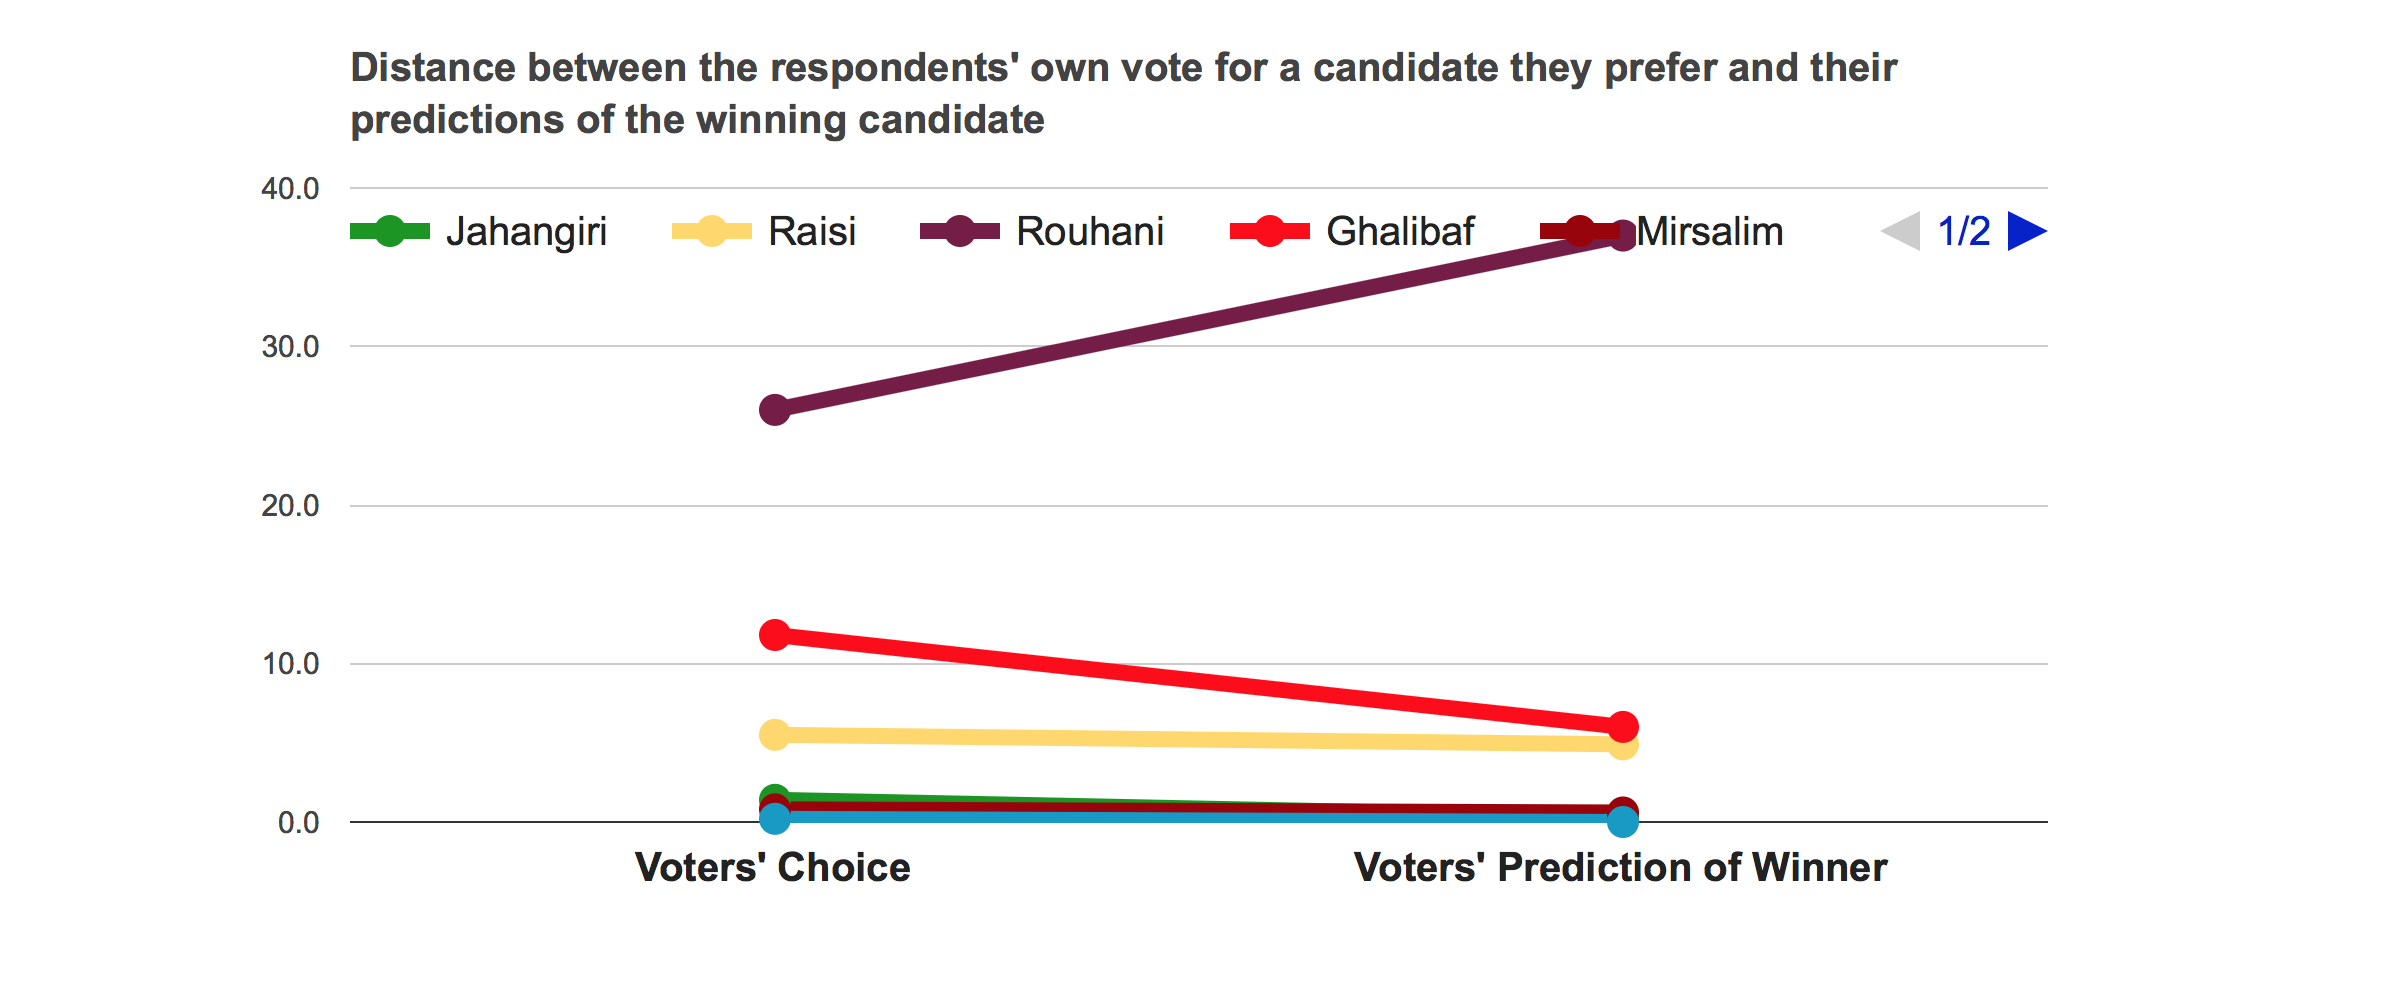
The distinctive result here is that respondents who predict Rouhani as having a greater chance of being the next Iranian president are about 40% more than those who intend to vote for him. In contrast, the proportions of those who predict victory for Ghalibaf are 50% less than those who intend to vote for him. The ratio of respondents’ prediction contra inclination towards a candidate does not show a significant difference when it comes to Ebrahim Raisi.
The distance between the respondents’ own vote for a candidate they prefer and their predictions of the winning candidate is represented in the the line chart.
Voter Turnout: Participation in the Elections
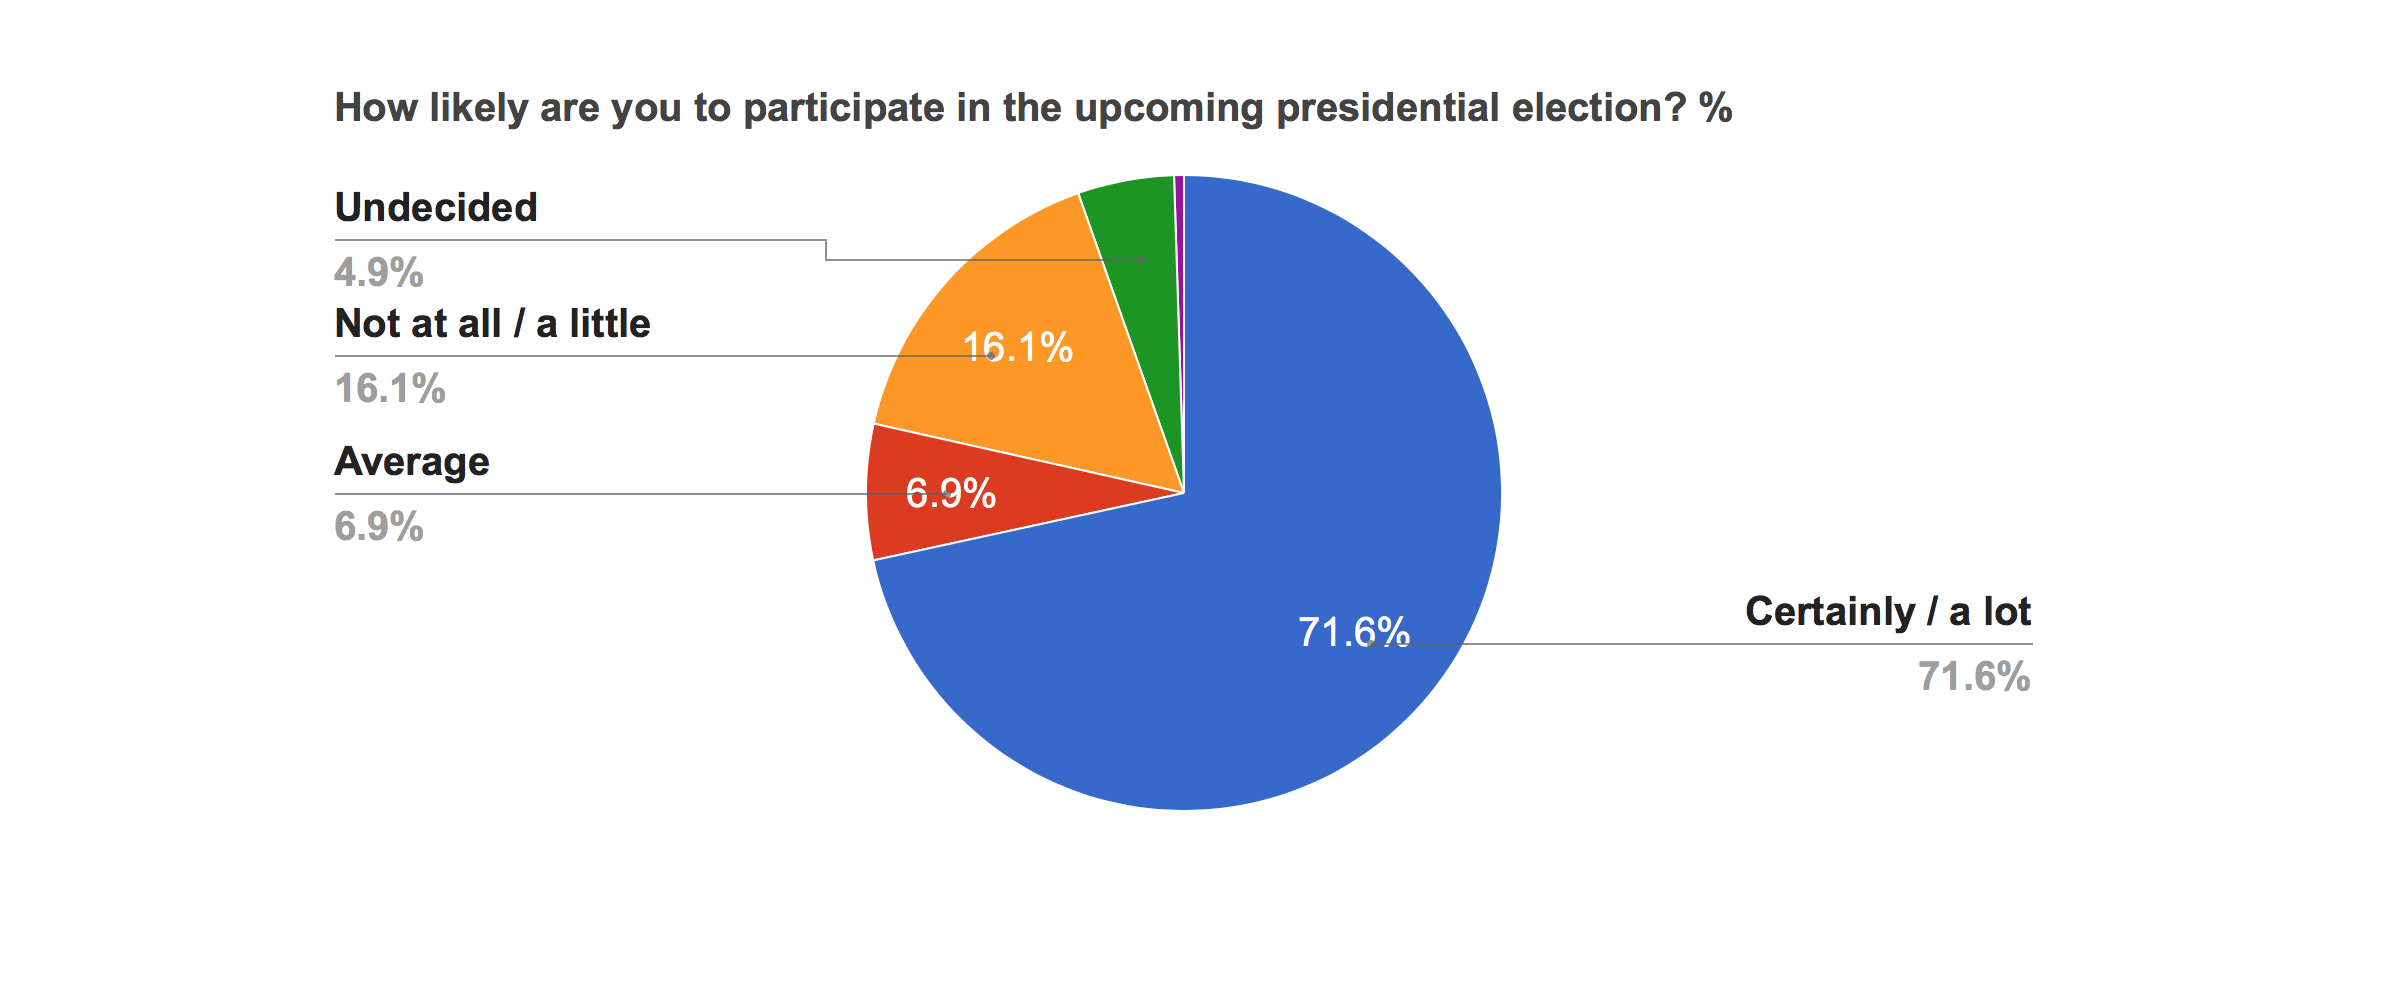
Around 72% of respondents say they are likely or very likely to vote in the May 2017 presidential election. In contrast, 16% say there is little chance or very little chance that they will participate in the elections. Besides the 7% of respondents that say they are somewhat likely to participate in the elections, 5% of the respondents have not yet reached a decision with regards to participation.
Projections of election participation rates in polls such as this one does not neatly translate to voter turnout rate on the day of the election. Projections of the voter turnout in polls are often more than the actual turnout on the day of the election; this is not unique to the Iranian context and is relevant to all pre-election polling.
Following Presidential Debates
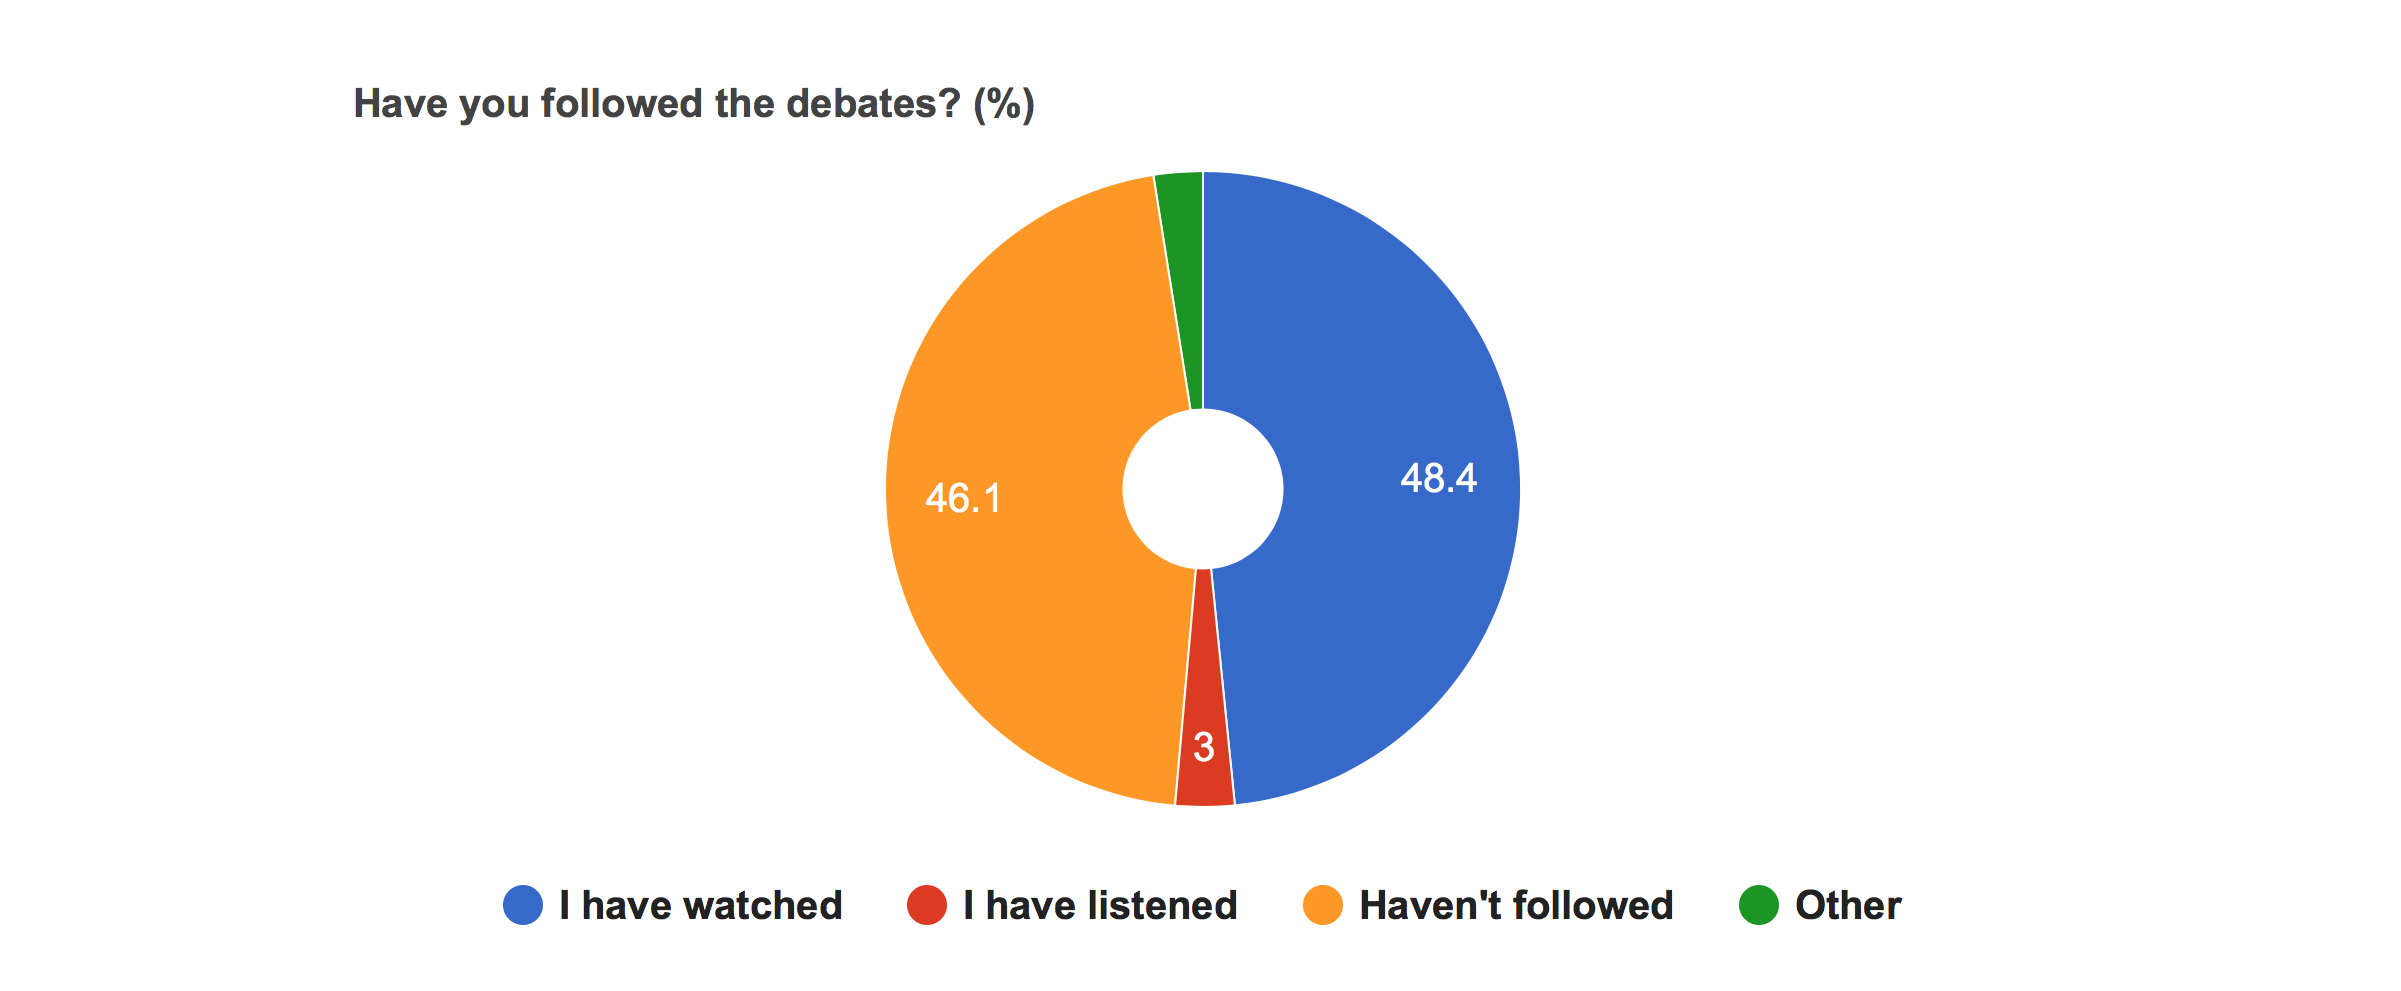
Following of the presidential debates divides the respondents to two groups of relatively same weight. About half of the respondents say they have followed the election debates and half of them say that they have not been following the debates. 48% of respondents have watched the debates and 3% of them have listened to the audio broadcasting of the debates.
The Most Important Problems and Priorities
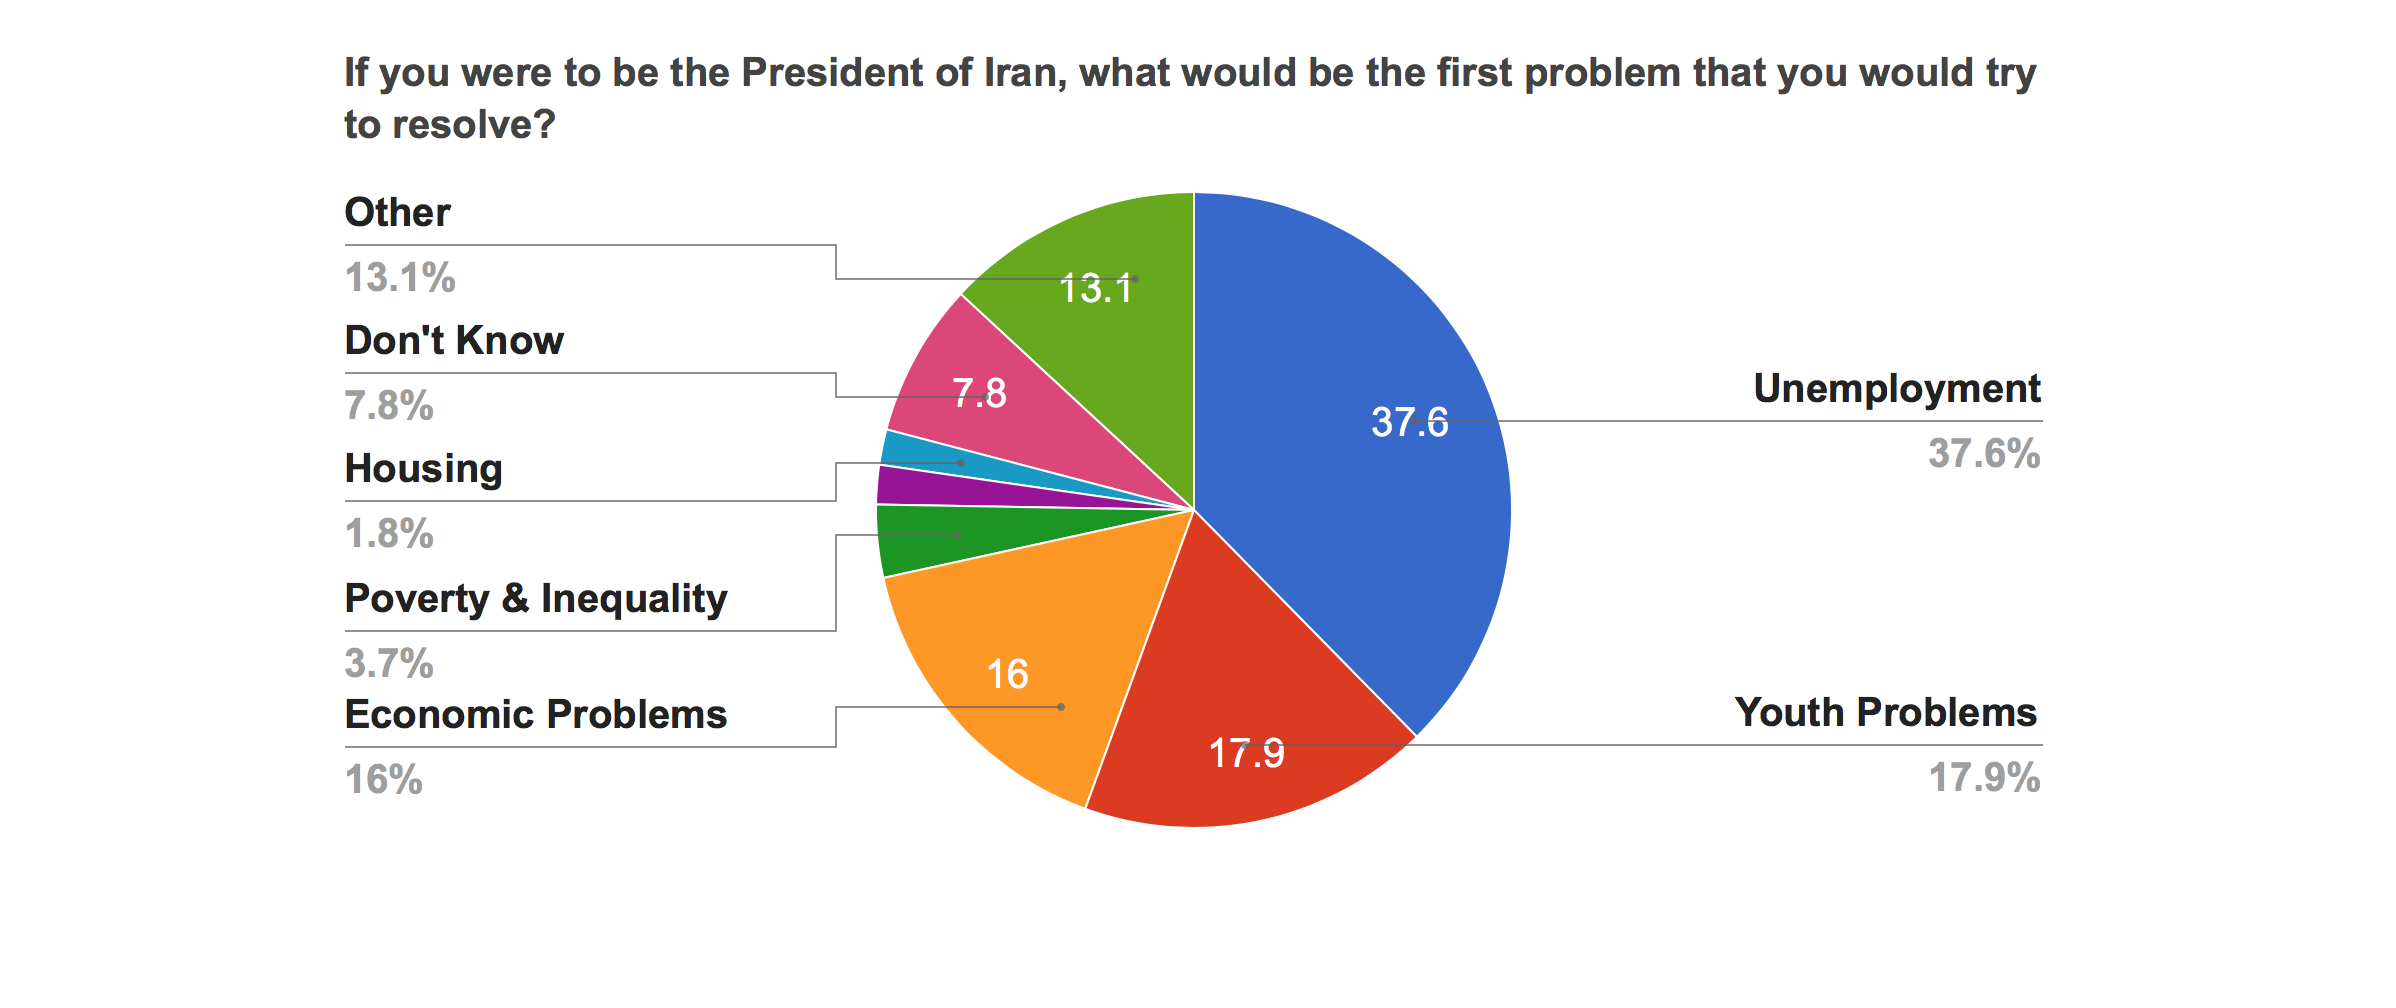
In order to have an understanding of the priorities of issues that the prospective president should tackle, respondents were asked which problem they would take on first, if they, themselves were the president.
As expected, the first issue that more than a third of respondents mentioned is “unemployment”. Next are problems that the youth face. Economic issues, including inflation and high costs of living rank third in the set priorities that the respondents mentioned.
Economic and political corruption, despite the attention it is receiving in the debates and the media, is only attaining a 2% rating among the participants of this poll.


